Q1 Product Round-Up: Competitive Insights, Enhanced UX, and More

Discover the latest updates to our solutions, including the fluen.ci app, and get a sneak peek into exciting additions via this release of our quarterly updates.
We are introducing a new series of quarterly posts to summarize updates to our solutions, including the fluen.ci (SM) app, and give a sneak peek into exciting additions coming soon.
We announced the launch of fluen.ci at our Cultural Fluency Summit in New York less than six months ago. At the Summit, we had the opportunity to share a preview of the exciting features we planned to empower marketers to confidently act on insights with instant access to fresh data that intersects cultural, demographic, and brand insights for actionability, all in the context of a beautiful, dynamic user experience.
We are pleased to share an update on all the new features and enhancements we introduced to our solutions in Q1.
Head-to-Head Brand Dashboard
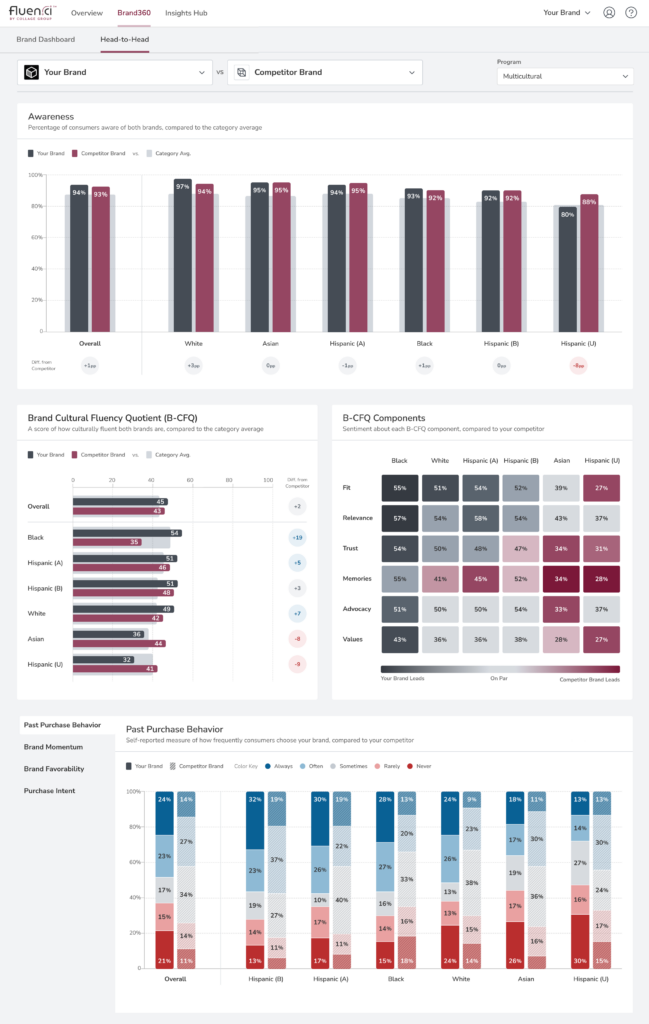
Trustworthy competitive intelligence is hard to find because the comparison of brand data may involve varying methodologies, data sources, and baselines. At Collage Group, we use a consistent baseline in our methodology, ensuring consistency and data accuracy across all our research and instant insights. This means that you can take action on our new Head–to-Head Dashboard’s competitive insights with confidence. The dashboard can be pre-loaded with a thousand brands you can compare side-by-side to quickly spot opportunities, threats, and inspiration. That’s 499,500 different combinations of comparisons!
With the Head-to-Head Dashboard, you will be able to:
- Benchmark your brand against competitors and industry leaders within the context of your brand’s performance
- Spot significant differences or promising opportunities that can inform your strategies for product bundling, product development, messaging and positioning, pricing, etc.
- Identify gaps in your branding and messaging strategy and take immediate corrective action with culture-driven insights

Industry Dashboard
Another way fluen.ci is putting competitive insights at your fingertips is the brand new Industry Dashboard that provides you with a category-level view at brand-specific consumer sentiment. Customers love using the Industry Dashboard to get a first look at an industry to understand the position of competing brands on the market, then dive into deeper research with other Brand360 dashboards and content in the Insights Hub to determine where, and how, brands can improve their reach and visibility.
Use the Industry Dashboard to:
- Quickly discern the competitive landscape within a category
- Gauge competing brands’ reach across diverse segments
- Kick-start research into an industry before diving into rich content
- Evaluate partnership opportunities
We are just getting started with industry insights. Next, we want to help you understand trends in an industry and across consumer spend.
Enhanced Search on Insights Hub
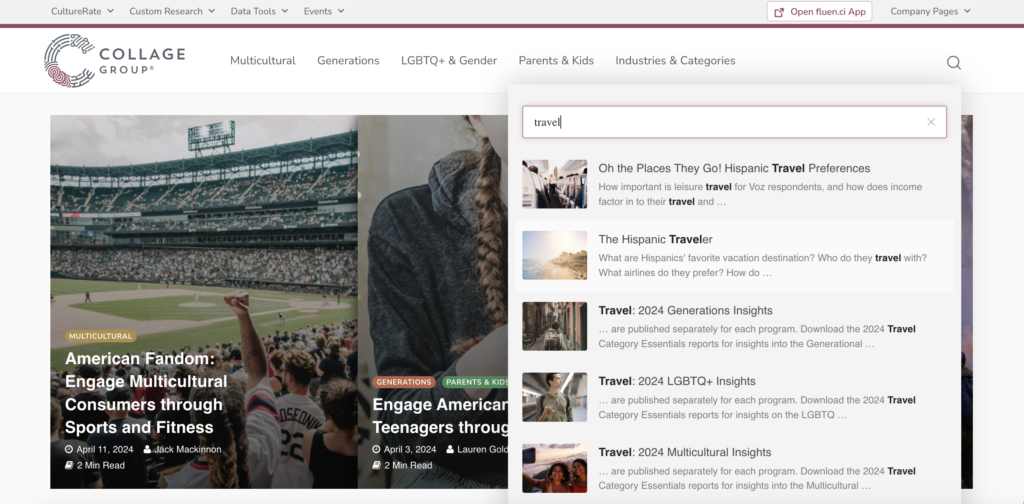
One of the biggest challenges our members have shared with us is the difficulty of navigating through 12+ years’ worth of research and content. To address this feedback, we rebuilt our search engine on the Insights Hub and enhanced the interface displaying search results. We’ve seen how these changes have sped up users’ ability to find relevant content and take action on insights confidently and more quickly. We’ll have some exciting new enhancements on Insights Hub coming in Q2 as well!

Audience Insights
We launched our custom Audience Insights solution to help brands go deeper into the cultural insights and psychographics of any segment, audience, or persona. This solution goes beyond bi-demographic data to intersect cultural, demographic, and brand insights and reveals an unparalleled depth of understanding about any group of consumers.
Our Members can consult Collage Group’s in-house experts to develop audiences or provide us with existing ones derived from their typing tools or segmentation frameworks.
More brands and insights for you
At the beginning of the year, we updated our survey methodology to allow for the best representation of brand data within its category and in our B-CFQ measurement. We’re also excited to share that we are on track to survey 1,000 brands in 2024, at least twice a year, to provide you with new insights and give you the ability to trend data in fluen.ci. With more frequent updates to industry and category data, you’ll have access to even fresher insights that reflect changes within the market over time.
We are excited to launch these new features to help you act confidently on insights and increase your relevance with today’s consumers to grow your business. Keep an eye out for our email announcements for the newest fluen.ci releases!